Guide to indices trading
This guide explains everything you need to know about stock market indices, from their history, types and performance, to how they are calculated and compiled. Learn how to trade them with CFDs on Asia Inside
What is indices trading?
Index trading is a popular way for investors to gain exposure to financial markets without having to research and invest in company stocks directly. Trading stock market indices is a way to reduce risk in stock trading. Rather than buying and selling individual company shares, you trade an index, or compilation of shares.
An index is calculated from the price of its constituent stocks, typically as a weighted average. Any index lists the criteria a company must meet to qualify for inclusion.
By tracking the performance of a large group of shares, an index aims to reflect the state of a broad industry sector, or a country’s stock market as a whole.
Fund providers create active and passive index-linked funds, and derivatives for investors to buy and sell. Indices reflect the performance of the overall stock market. Movement in an index’s value indicates the health of the economy or industry sector it tracks.
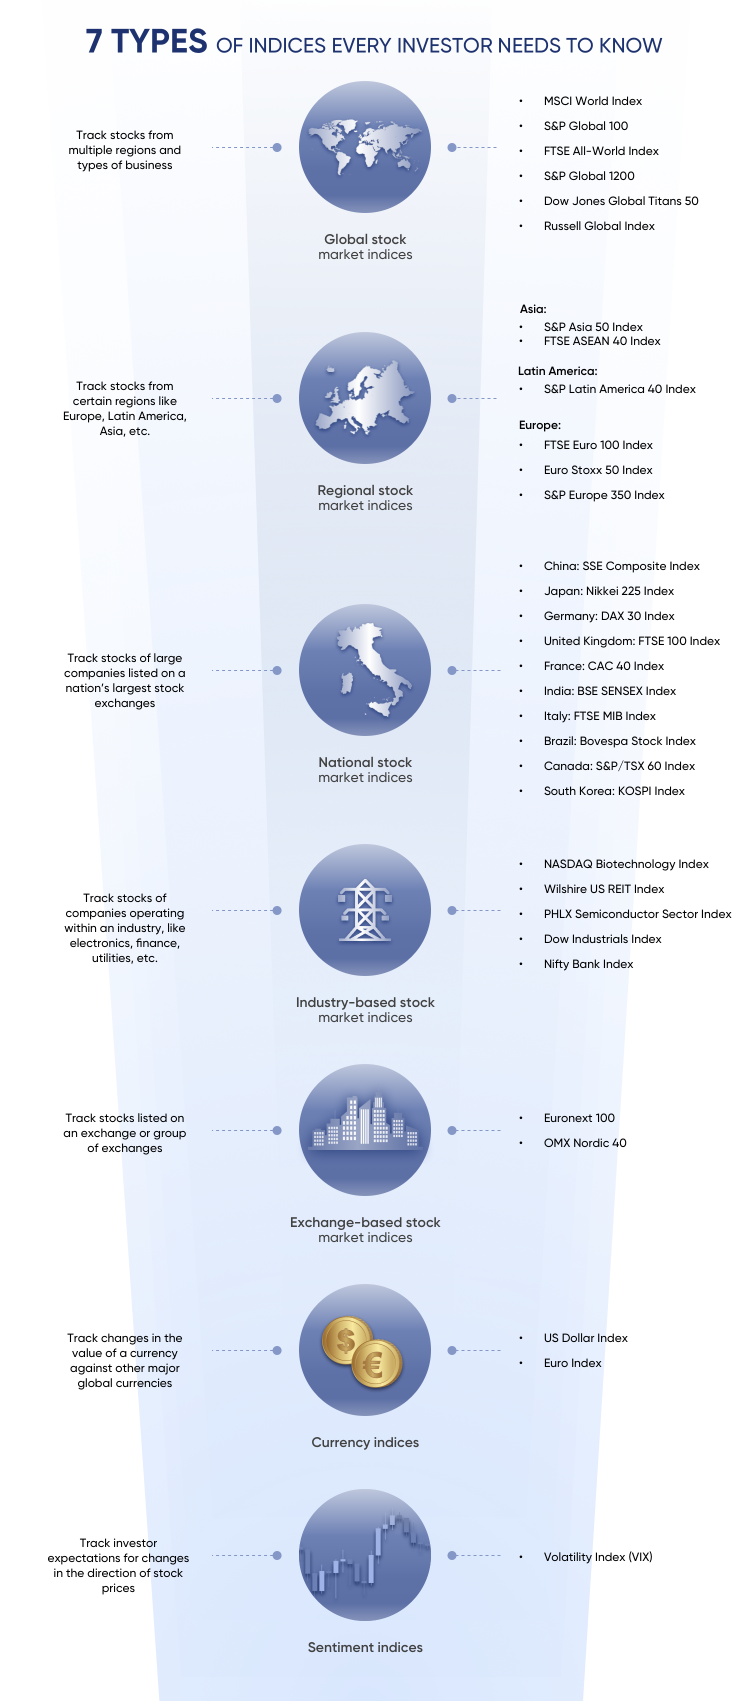
Generally, there are seven common types of indices: global, regional, national, exchange, industry, currency and sentiment-based.
he world’s major financial markets each have at least one financial index. For example, the S&P 500 (US500) is an index of the 500 largest companies in the US.
The Euronext 100 (N100) tracks the largest stocks on Europe’s Euronext exchange, comprising companies listed in The Netherlands, France, Belgium, Portugal and Luxembourg. Other major indices include the UK’s FTSE 100 (UK100), Germany’s DAX 30 (DE30), Hong Kong’s Hang Seng (HK50) and Japan’s Nikkei 225 (J225).
Industry-specific indices are popular among traders. For example, the NASDAQ–100 (US100) in the US lists the leading 100 high-tech company stocks. It’s used as a barometer of the US technology sector’s performance.
Stock market indices are often referred to in news reports on financial markets and economies. They’re considered indicators of confidence in business and the stock market, performance by top companies in the given market, and economic health.
Stock markets are affected by political events and monetary policy, such as interest rate changes, currency fluctuations and international trade.
Benefits of indices trading
Many individual investors opt to trade indices in their investing accounts, particularly if they’re saving for retirement.
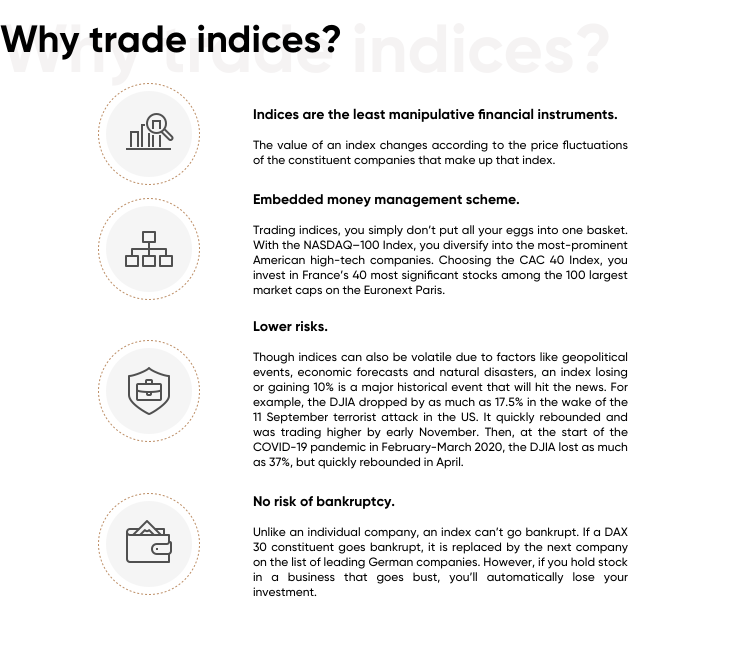
Index trading gives investors exposure to a range of companies. While some company share prices fall over time, others rally. Diversification evens out extremes in volatility.
Index values fluctuate each trading session, but they do not lose or gain large amounts unless there’s a major change, like a market crash, geopolitical event or natural disaster.
Indices pose a lower risk than investing in individual stocks. If you invest in a company stock and the company goes bankrupt, you can lose your investment. But if one company in an index folds, it can be replaced by the next largest company outside the index. Depending on the size of the failed company and the performance of the other constituents, the value of the index may dip temporarily, or it may have no noticeable impact at all.
On the other hand, index investing limits the returns you receive from a high growth company. Individual growth stocks can outperform an index by large multiples, although they carry higher risk.
What are the top 5 stock market indices to invest in?
There are 3.05 million stock market indices around the world, according to the Index Industry Association. They range from large company indices to industry sub-sectors, such as consumer staples, and themes, like environmental, social and governance (ESG).
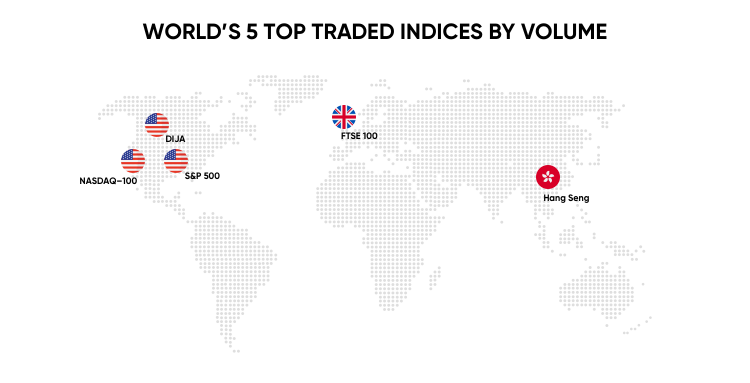
The top five indices by volume are the NASDAQ–100, S&P 500, Hang Seng, FTSE 100 and DIJA.
.
NASDAQ–100 (US100)
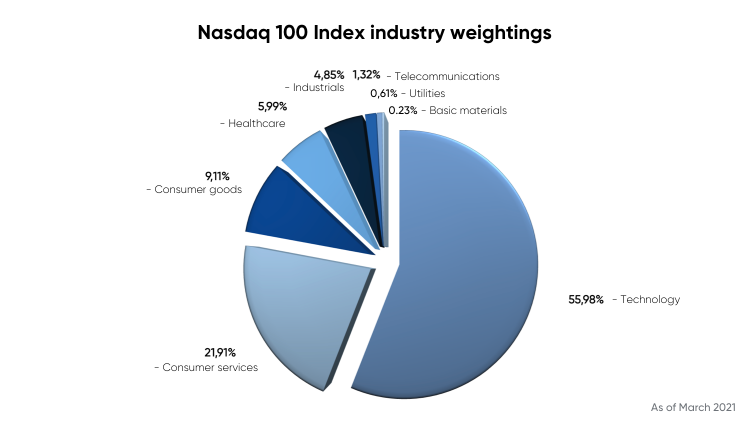
The NASDAQ–100 is an index of the 102 largest US and international non-financial stocks on the NASDAQ Stock Exchange. The holdings are heavily allocated towards industries such as technology, consumer services and health care.
The NASDAQ–100 is a modified capitalisation-weighted index – it’s weighted towards stocks with the highest value. A company’s market capitalisation (also known as market cap) is calculated by multiplying the number of shares it has outstanding by its share price. The index has certain conditions that limit the influence of the largest companies.
Technology companies account for a 56% share of the index’s weight. The 10 largest account for 57.5% of the index.
The NASDAQ selects its constituent stocks once a year in December, based on market data at the end of October and the total of outstanding shares at the end of November. The index is rebalanced every March, June, September and December.
S&P 500 (US500)
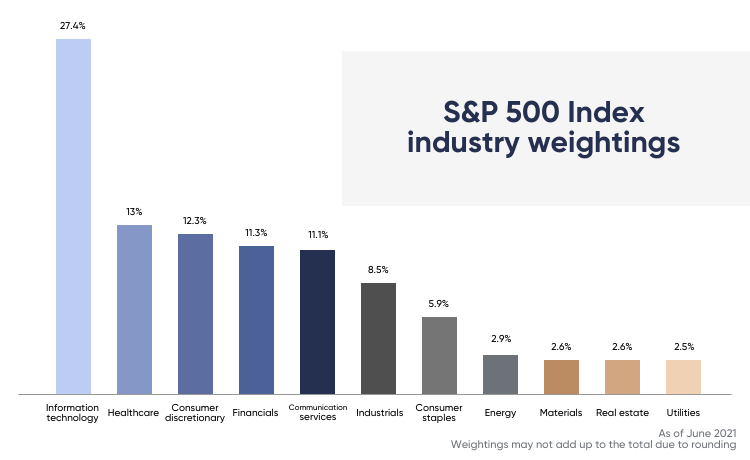
The S&P 500 is compiled by S&P Dow Jones Indices and governed by the US Index Committee. It’s one of the most popular indices. The large number of diverse companies it tracks is viewed as one of the best indicators of the performance of US markets and the overall economy. The index covers around 80% of the market capitalisation of the US stock exchanges.
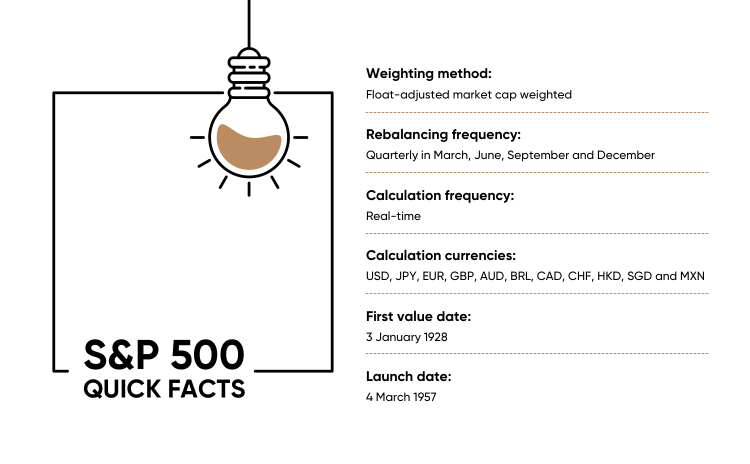
The S&P 500 is weighted by the float market capitalisation of constituent stocks, meaning it includes shares freely traded on the market and not shares held by company board directors, executives and other insiders.
Companies must meet several criteria to be eligible for inclusion, such as earnings, liquidity and share float. Even then, acceptance is not automatic. Companies must continue to meet the requirements or face removal.
Decisions are made at the discretion of the US Index Committee, which meets regularly to make decisions about admitting companies to the index and implementing changes to the methodology. The index is rebalanced every March, June, September and December.
S&P Global estimated that there was over $11tr in funds benchmarked to the index at the end of 2019, including $4.6tr in passive tracker funds.
Hang Seng (HK50)
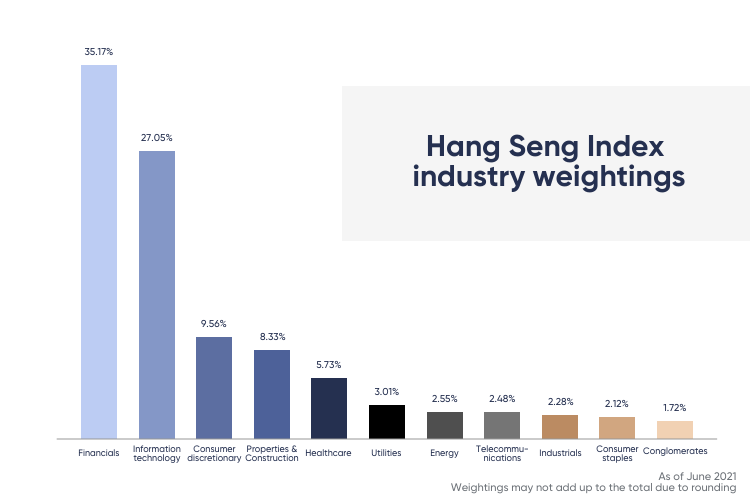
The Hang Seng is an index of the largest companies in Greater China listed on the Hong Kong Stock Exchange. Managed by Hang Seng Indexes, a subsidiary of Hang Seng Bank in Hong Kong, the HK50 is an adjusted market cap-weighted index based on companies’ free float shares. It applies an 8% cap to prevent a single stock from dominating the index.
To reflect price changes in the market’s major industries, stocks in the index are grouped into four sectors: finance, utilities, property, and commerce and industry.
The index expanded from 55 to 58 companies on 7 June 2021. Its target is to include 80 companies by mid-2022 and then be fixed at 100 companies, with 20-25 constituents classified as Hong Kong companies.
Stocks are evaluated for eligibility by the HSI Advisory Committee based on how representative they are of the market, turnover, financial performance and market cap. Constituents failing to meet these requirements can be considered for removal.
The smallest and least liquid constituents may be considered for removal even if they meet the criteria, depending on whether there are appropriate replacements. The index is reviewed and rebalanced every March, June, September and December.
FTSE 100 (UK100)
The Financial Times Stock Exchange 100 Index, known as the FTSE 100, is an index of the 100 largest companies listed on the London Stock Exchange by free float market cap, with companies screened for size and liquidity. It’s compiled by FTSE Russell, a subsidiary of London Stock Exchange Group (LSEG).
As the UK is one of the world’s largest economies and a major financial centre, the FTSE 100 is an important indicator of the performance of UK businesses. The FTSE index represents around 81% of the value of the UK market on the London Stock Exchange.
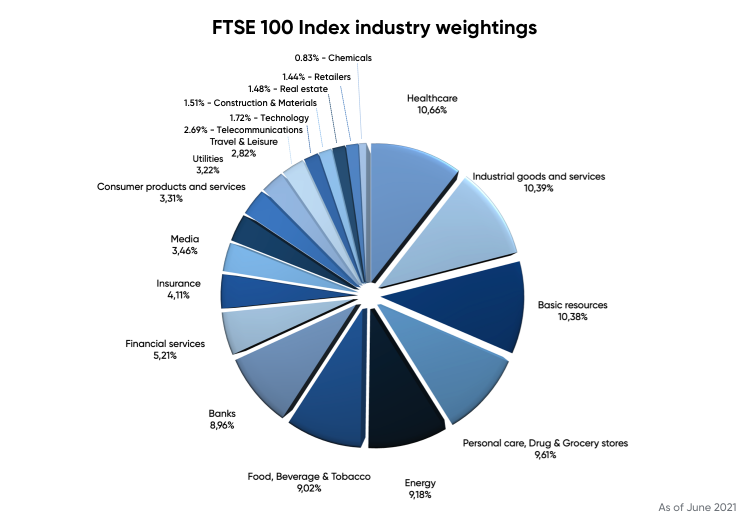
Stocks are screened for price, voting rights, free float, foreign ownership, size and liquidity. The index is rebalanced quarterly.
Dow Jones Industrial Average, or DJIA (US30)
The DJIA was founded in 1896, making it one of the world’s oldest indices. Typically referred to as “the Dow”, the index is compiled by S&P Dow Jones Indices.
Unlike the S&P 500, the index is weighted based on the price of one share in each of its constituent companies. The index lists 30 blue-chip companies in the US and covers all industries except transportation and utilities.
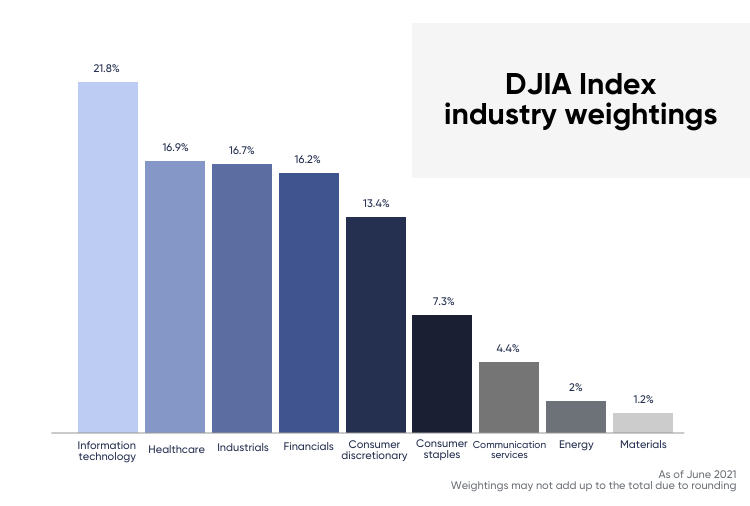
The DJIA has no formal eligibility criteria. A stock is typically acceptable if the company is headquartered in the US, has a good reputation, sustains growth over a period of time and a large number of investors are interested in trading the stock. The index is governed by the Averages Committee, which makes changes as needed rather than on a regular schedule.
There was $32bn benchmarked to the Dow at the end of 2019, including $28bn in passive securities, according to S&P Dow Jones Indices. The trading volumes of investment products linked to the Dow are high relative to the number of assets that track the index, reflecting the index’s popularity.
What is the most popular stock market index?
The stock market index with the highest average trading volume is the NASDAQ–100. The Invesco QQQ ETF (QQQ), which tracks the index, has become one of the world’s largest ETFs.
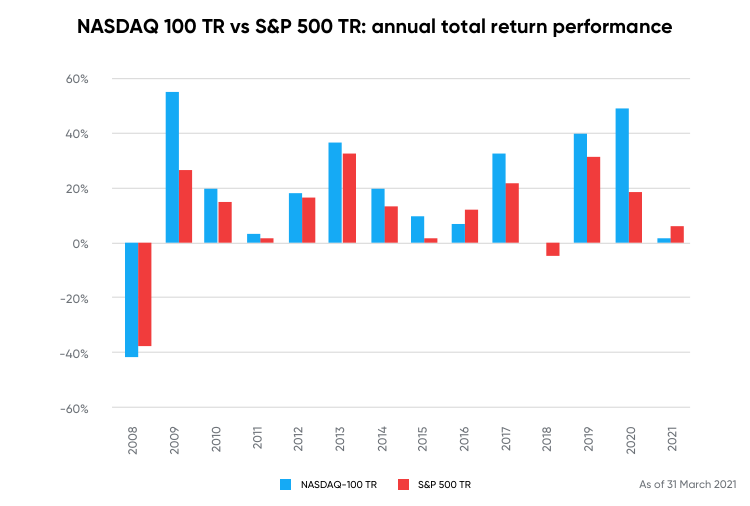
Between 2009 and 2019, the NASDAQ-100 gained 372%, based on price, with a total return of 430%, including dividends. However, as always, it’s crucial to remember that past performance is no guarantee of future returns.
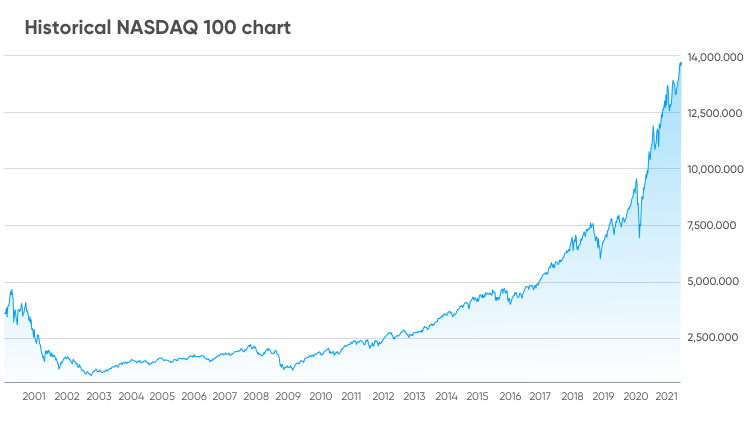
With such a concentrated focus on high-growth companies in the technology sector, the NASDAQ–100 is the most volatile major US market index. While that implies higher risks, it also presents opportunities for investors to profit from trading on volatility.
Comparing total annual returns, which reinvest dividends, the NASDAQ–100 Total Return Index has outperformed the broader S&P 500 Total Return Index in 11 of the past 13 years, according to a first-quarter review by Nasdaq Investment Intelligence.
Still looking for a broker you can trust?
Join the 380.000+ traders worldwide that chose to trade with Asia Inside
1. Create & verify your account

2. Make your first deposit

